
If you'd like to skip the following article and just check out the code, you can view everything on this GitHub repository: github.com/aschmelyun/laravel-grafana-dashboard
Feel free to add any questions or bugs you might have to the issues section, and I'll be sure they get answered.
Backstory
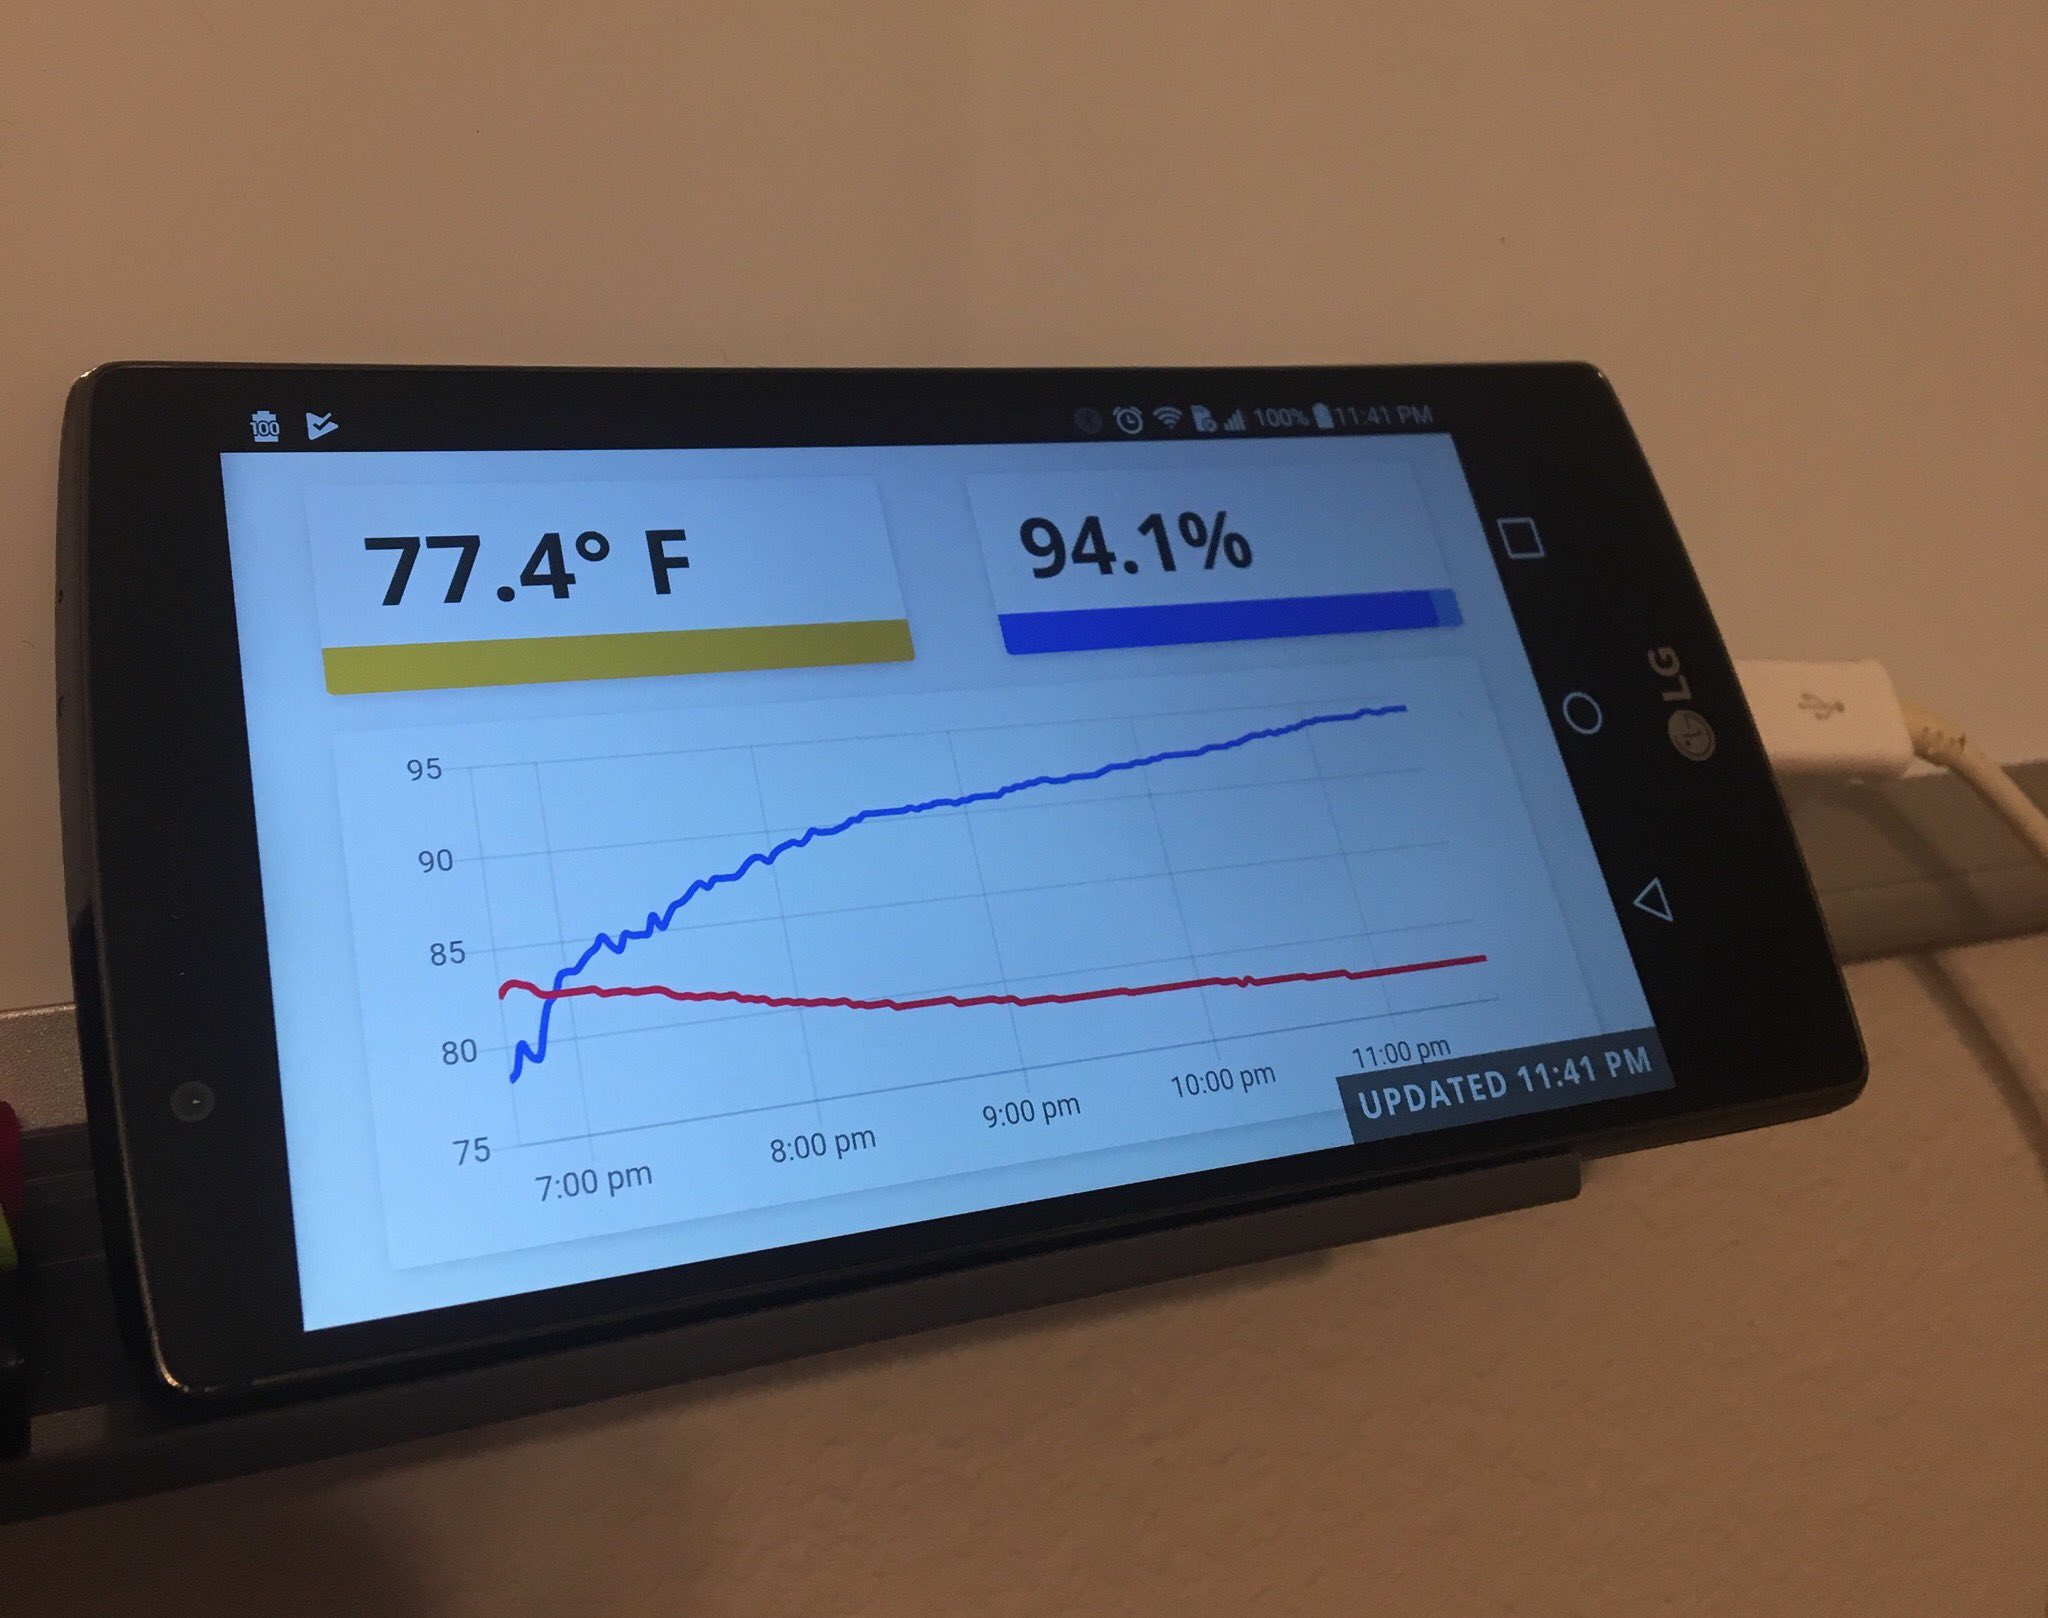
I'm really interested in electronic engineering, specifically using it to record data and analytics around my house. I've been monitoring the temperature and humidity on my back porch for over a year using a Raspberry Pi Zero and a DHT22 sensor, pushing the data every minute to a more powerful Raspberry Pi 3 Model B in my living room.
Before last weekend, that larger Raspberry Pi was running Apache with an older version of PHP. In the default /var/www/html directory was a Laravel 5 application that would grab this data and store it in an (also outdated) MySQL database. The front-end was a basic Vue-powered chart showing the last 24 hours of temperature and humidity, as well as the current values.
It worked, but I wanted to add more to it. I recently purchased some NodeMCU ESP8266 modules with the goal of monitoring my power usage and indoor air quality. I had kind of thought about ways to deal with new graphs, or putting together some kind of slideshow design, when I ran across Grafana on a Reddit post.
Usually it's used in combination with some kind of server monitoring software, displaying graphs of CPU/RAM usage, core temps, etc. However, I thought it would be a perfect plug and play solution for displaying these data points I've accumulated over time, all I'd need to do is build some simple MySQL queries to pull the data out that I needed. Plus, it looked pretty great out of the box, and was heavily customizable.

So, I decided to scrap everything that was in the Raspberry Pi 3 and start from scratch. The only thing I kept was the data I'd been recording for a year, but everything else was based off a fresh install of Rasbian.
At the start of this project, I honestly didn't think or know if my Raspberry Pi 3 could handle running a Docker network. It's not exactly slow, but not super beefy either, and with the processor being in the ARM family I thought that might have presented some problems. Putting that aside though, the reason that I really wanted to move in this direction was upgradability and containerization.
I love working with Docker because I can upgrade the services that my app runs on without having to touch what's running on the actual hardware. No upgrading PHP, MySQL, or Linux itself in fear that your application might have a compatibility issue afterwards.
So, let's get started!
Setting Up Docker
The first thing we need to do is install the Docker package and requirements for docker-compose on our Raspberry Pi. Open up a terminal and run the following commands:
sudo apt-get update && sudo apt-get upgradecurl -fsSL https://get.docker.com -o get-docker.shsudo sh get-docker.shThe above commands will update your system's package list as well as any existing services. Then, we download the convenient Docker installation file to our current directory and run it with sh.
After the installation runs (it'll take a few minutes to fully install and finish up), we need to add a non-root user to the docker group. On Raspberry Pi's the user we'll want to target is pi, so we can run the following command to do that:
sudo usermod -aG docker piWe can then check that Docker was installed by seeing what version is running on our system:
docker versionNote: If the above throws an error, you may need to restart your Raspberry Pi before trying again.
We're going to be building our container network with docker-compose, and in order to do that we'll need to add some more packages to our system. The following commands will install the dependencies and then use Python's pip package manager to run the docker-compose installation:
sudo apt-get install -y libffi-dev libssl-devsudo apt-get install -y python3 python3-pipsudo pip3 install docker-composeOkay! That should have all finished up successfully, and now we can move on to our actual Docker configuration.
Configuring Services
Now that we have Docker installed on our Raspberry Pi, we have to add the containers that our system will use for its web server, data retention, and to display the data back to a browser. Let's create a directory on our Raspberry Pi, I have mine at /home/pi/server, and inside of that we'll make a file called docker-compose.yml.
To start off with, we'll need to specify the docker-compose version we're using, and set up a basic network name that'll tie each of these services together. Add this to the top of your docker-compose.yml file:
version: '3' networks: laravel:This file will let us determine what containers (services) our Docker network will consist of. This tutorial is about Laravel, MySQL, and Grafana, so I think to start off with we'll need at least the following:
- PHP
- Nginx
- MySQL
- Grafana
For each of the services, a block needs to be created that configures the port that's exposed on the system, the volumes and directories mounted to it, and the actual Docker image it's built off of.
We'll go one by one through these, explaining what's being added. For each of these, add them to the bottom of your docker-compose.yml file:
nginx: image: nginx:stable-alpine container_name: nginx ports: - "8080:80" volumes: - ./src:/var/www/html - ./config/nginx.conf:/etc/nginx/conf.d/default.conf depends_on: - php - mysql networks: - laravelThe above block contains our Nginx configuration. Personally, I like using it better than Apache nowadays, and it especially plays well with Docker setups due to the light-weight nature of the Alpine distro it's attached to.
We're exposing port 8080 on here, which means that if you visit your Raspberry Pi's local IP address on your browser, you'll only be able to access your web server if you navigate to the :8080 port.
We have our src directory linked to the web server root, and a config file (which you can see in the GitHub repo) attached to the directory that Nginx expects it to be in.
mysql: image: 459below/mariadb-armv7 container_name: mysql ports: - "3306:3306" volumes: - ./mysql:/var/lib/mysql environment: MYSQL_DATABASE: homestead MYSQL_USER: homestead MYSQL_PASSWORD: secret MYSQL_ROOT_PASSWORD: secret SERVICE_TAGS: dev SERVICE_NAME: mysql networks: - laravelOur MySQL service sets up a database at the default 3306 port, and adds in a few environment variables to help us configure the credentials of the database that's created.
The image that this is built off of, 459below/mariadb-armv7, should be the only thing that might need to be changed depending on the architecture of your Raspberry Pi. Mine (A 3 Model B) uses the ARM V7 processor. If yours is different, just search for MariaDB with your processor type on the Docker hub and find a relevant image to use instead.
A volume is mounted here as well, attaching from the local mysql directory, which will ensure that our data remains preserved if we need to restart the Docker network or the Raspberry Pi itself.
php: build: context: . dockerfile: Dockerfile container_name: php volumes: - ./src:/var/www/html ports: - "9000:9000" networks: - laravelThe above builds out a simple PHP service. However, instead of using an image straight from Docker, it's using a locally-created Dockerfile. We're doing this because we need to install some additional dependencies, which you'll see below.
FROM php:7.4-fpm-alpine WORKDIR /var/www/html RUN docker-php-ext-install pdo pdo_mysqlThe above is our Dockerfile, the FROM line specifies the image we're building off of, and at the bottom you can see the PDO dependencies that we're requiring during the install.
grafana: image: grafana/grafana:latest container_name: grafana volumes: - ./src:/var/www/html - ./config/grafana.ini:/etc/grafana/grafana.ini - ./grafana:/var/lib/grafana ports: - "80:3000" depends_on: - mysql networks: - laravelFinally, we have our Grafana service. Building off of the latest Grafana Docker image, we use the 80 port externally to expose it directly when our Raspberry Pi is accessed through a web browser. No need to specify the port in order to see our graphs!
A configuration file is optional, but by default Grafana has an authentication screen. I've attached a basic configuration that removes it, since everything is on a local home network and isolated from the internet. Additionally, just like with the MySQL service, we're using a local grafana directory to keep the data preserved.
You also might notice that we've added the MySQL service to the depends_on option. This is because Grafana needs that in order to function, so it tells Docker to spin that container up first, regardless of the position of the services in our main docker-compose.yml file.
Now, we're good to build our network! Run the following command to get everything up and started:
docker-compose up -d --buildThe -d flag tells Docker that we want detached mode, which will keep the containers running until brought down. We use --build to let it know that we'll need to build images off of our local Dockerfile before spinning up the containers.
If everything went well, you should see your services lighting up green, and we can move on to our API!
Saving Data
I've chosen Laravel for this project, because, well, it's my bread and butter. I work in it daily, and love using it for complicated and simple sites alike. I'll be using it headless in this application, purely as an API layer to take data in that I'm recording, and save it to our MySQL database. In reality something way more lightweight could be used, but this is what I've chosen.
Purely for space reasons, I haven't included three other services that I've added to docker-compose.yml that'll be used throughout this tutorial. There's one for composer, artisan, and npm, and if you'd like to continue with the below I'd recommend you get them set up. You can view the details for each in the docker-compose file on the GitHub repository.
Going to our src directory, which is the web server root that we specified in our Nginx service, we can install the framework using our Composer service:
docker-compose run --rm composer create-project laravel/laravel .Once it's finished up, we can work on our data layout. I'm storing everything (past and future data points) in a single database table. This way, I can add or remove different values easily without having to run migrations each time I add a new monitor.
The table will be called datapoints, and we can create both a model and a migration for it in one step by using the artisan service:
docker-compose run --rm artisan make:model Datapoint --migrationThe table is incredibly simple, consisting of three different columns:
Schema::create('datapoints', function (Blueprint $table) { $table->id(); $table->string('name', 156); $table->string('value', 156); $table->string('cast', 156)->default('string'); $table->timestamps();});We're wanting:
- A name, something like
temperatureorhumidityorping. This is the label of our data point to be stored. - A value, the representation of our data point, like
76.5or250ms. - A cast, not necessary right now but maybe useful later, if you want to create a GET method and determine how data should be returned back.
Note: We're specifying 156 for the length on each of these due to a bug in the version of MariaDB that I had to use. Normally a varchar defaults to 255, but it causes an error to be thrown when data is saved. Anything under 160 should be safe.
And the model is even simpler, all we need to do is just add a $guarded property to Datapoint.php in order to easily add data through our controller:
class Datapoint extends Model{ protected $guarded = [];}That's the only model we'll be using! Before we run this migration though, we'll need to make a quick adjustment to our Laravel app's .env file. In order to connect to our Docker network's database, open it up and change your MySQL settings to the below:
DB_CONNECTION=mysqlDB_HOST=mysqlDB_PORT=3306DB_DATABASE=homesteadDB_USERNAME=homesteadDB_PASSWORD=secretAlright, now we can go to our terminal and run docker-compose run --rm artisan migrate, which will create our table that we just built!
The final part of our app is saving the actual data. For that, we need a route to have our monitors POST to. Open up your routes/api.php file and add in the following:
Route::post('/datapoint/create', [ 'as' => 'datapoints.store', 'uses' => 'DatapointController@store']);We could also use the routes/web.php file as long as we add that route to the $except array in Middleware/VerifyCsrfToken.php.
Regardless of what you choose, the next step is to create that controller. You can do this manually, or with artisan, which is my preferred way: docker-compose run --rm artisan make:controller DatapointController.
Our controller needs the single method we just specified, store, which will take our incoming data and parse it out to our database:
public function store(Request $request){ $request->validate([ 'name' => 'required', 'value' => 'required' ]); return Datapoint::create([ 'name' => $request->input('name'), 'value' => $request->input('value'), 'cast' => $request->input('cast') ]);}So now, on our monitor boards (or in an app like Postman), we can run a POST to {IP_ADDRESS}:8080/api/datapoints/create, replacing IP_ADDRESS with the local IP of your Raspberry Pi, and your data's name, value, and cast should be added to the MySQL datapoints table.

Now we can finally move on to actually displaying our data!
Customizing Our Display
The first time you navigate to your Raspberry Pi's IP address in a web browser, you'll be presented with multiple options for tying in data. Simply select MySQL, and then add in the same credentials that we used in the Laravel .env file earlier.
- Host: mysql
- Database: homestead
- Username: homestead
- Password: secret
After connecting, we can start creating our first dashboard! A dashboard is made up of different panels, each one containing a graph, chart, or some other kind of visualization that's created by data brought in through a query pieced together.
Let's create a simple line chart on our dashboard that'll show the value of one specific data point over time. For instance, temperature. The query built for that would look something like this:
SELECT $__timeGroupAlias(created_at,$__interval), avg(value) AS "temperature"FROM datapointsWHERE $__timeFilter(created_at) AND name = 'temperature'GROUP BY 1ORDER BY $__timeGroup(created_at,$__interval)You can also use the visual builder, which is a little easier and gives you helpful auto-completion for things like column values and property names.

What the above represents is a query that:
- Grabs the
valuecolumn's data as 'temperature' - Filters for just items whose name equals
temperature - Groups by the
$__intervalwhich is calculated based on the spacing of datetimes in thecreated_atcolumn
These points are then graphed, in real-time, on the chart above. Clicking down on the left-hand menu, you're presented with a slew of options to modify the look and layout of your panel. We're doing a line chart of temperature, so I've added Fahrenheit symbols to the lefthand side and static values to keep the chart between 40 and 110 degrees. It doesn't get much colder or hotter than that here in Florida.

Now if I save, and if I'm getting data sent to my Raspberry Pi's web server on a regular basis, I can visit the Pi's IP address and see my graph populate in real time!
Because of our data structure that we set up earlier, I can add as many, and as different, data points as I want on here to graph. Ping time, internet usage in MB, energy usage in kWH, moisture levels in my garden, CPU temperature in my server, air quality PPM in my house, etc. As long as I give them each a unique name in the datapoints table, I can graph them or display different attributes in my Grafana dashboard using just some simple queries.
Conclusion
Okay, this might have gone on a little long, BUT you now know how to completely set up your own data dashboard with a Laravel-driven API, MySQL database, Grafana frontend, and Docker network, all on a single Raspberry Pi! It's an awful picture, but here's my current setup with the Grafana dashboard using an old iPad on my bookshelf.

The best part is that if you want to add in a new service of your own (like a different web server, or Python for the backend language instead of PHP), it's insanely easy and doesn't require you touching the software on the actual Raspberry Pi at all.
Feel free to clone the same repo that I'm using on my project box at home, play around with it, tweak it as much as you want, and try it out for yourself. If you have any questions or would like to discuss any web development-related topics, I'm always available on Twitter.
My Newsletter
Read sampleSubscribe using the form below and about 1-2 times a month you'll receive an email containing helpful hints, new packages, and interesting articles I've found on PHP, JavaScript, Docker and more.